
To enhance understanding of trauma center locations and their impact on access to trauma care, our descriptive study uses geographic information system (GIS) software and mapping to integrate location, transportation, and population data. Using data from Minnesota, rated No. 1 in the United States for health, we demonstrate the use of techniques to analyze the capacities, consequences, and opportunities arising from the distribution of trauma centers. These techniques can be applied to data from other states and locales.
The classification system of trauma centers helps clarify the services available and the variable distributions of trauma services. The use of integrated mapping tools can inform the interpretation of trauma services available and opportunities for expanding or elevating trauma services to benefit the communities and populations who could benefit. Using Minnesota as an example, our method introduces a marginal gain analysis to describe the gains from elevating the level of existing trauma services or strategically adding a new trauma center.
LITERATURE BACKGROUND
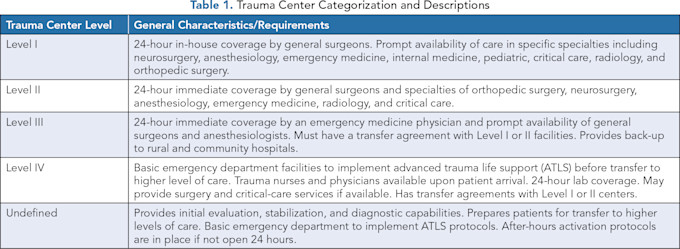
Trauma care systems in the United States are developed to serve population needs, leading to variation in geographic distribution and access.(1,2) There are five levels of trauma centers in the United States as shown in Table 1. Level I and II trauma centers are located in urban areas; Level III and IV trauma centers have transportation agreements with higher level trauma centers.(3)
While the number of trauma centers in the United States has increased, the location of these new trauma centers does not necessarily improve access to care for rural and remote populations,(4) producing and reproducing rural inequities in care if there is not a thoughtful expansion of trauma centers above a Level II designation.(5)
Access to trauma centers is a critical issue in rural areas. Level I and II trauma centers are not easily accessible for rural and remote populations, and long prehospital times likely contribute to higher mortality rates seen among rural trauma patients.(6,7) In 2011, Hsia and Shen found 12% of urban areas had barriers to accessing centers, which rises to 31% for rural areas. Carr, et al., found rurality, including far-rural and remote-rural communities, was associated with decreased access to trauma care.
Rural disparities in trauma care access are associated more closely with economic factors than with race and ethnicity.(4) Interestingly, higher income is associated with greater access across the rural-urban spectrum, and poverty is associated with less access in urban areas. This association is not significant in rural areas, however, highlighting the additional challenges of geographic access for rural populations. These contrasting findings across the rural-urban spectrum may mask local subtleties and regional differences among urban-rural trends at the national level.
Medrano, et al., take a similar approach to geographic gaps in access to care, focusing on how upgrading Level III and Level IV trauma centers can enable better access to trauma care.(8) While this process is helpful in improving capacity to deliver trauma care to larger geographic areas, it does not address the importance of Level III and Level IV trauma centers in providing geographic access to any form of trauma care.
The Minnesota Trauma System indicates that 98% of Minnesotans are within an hour of a trauma center.(9) Much of the north-central and western parts of Minnesota have less drive time to Level III trauma centers than Level I and II, and 81 of the 131 trauma centers in the state are Level IV centers. Therefore, a better understanding of where these trauma level centers are located and the populations that have access to them is needed to inform the development of new trauma centers and the enhancements to existing centers that would create the most equitable improvements in trauma care access.
METHODS
To examine the population characteristics associated with access for each trauma level, we combined hospital location with road networks and sociodemographic data. A listing of all hospitals in Minnesota with a trauma level designation was acquired from the Minnesota Department of Health (N=131); it includes several hospitals in eastern North Dakota and South Dakota frequently used by rural Minnesotans because they are the closest trauma centers for a number of Minnesota communities bordering the Dakotas.
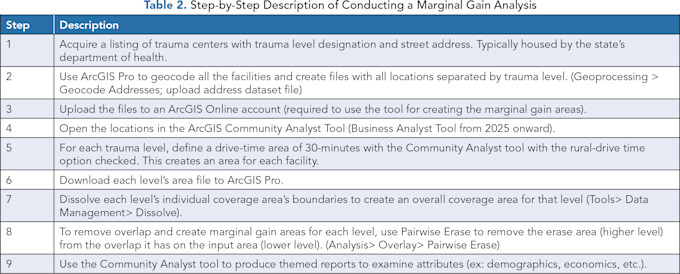
This listing included the address of the hospital as well as its designated trauma level. The hospital locations and designated trauma level (Level I - Undefined) were geocoded and mapped in ArcGIS Pro and then imported into the ArcGIS Community Analyst tool. The analysis was run in February 2024. A step-by-step description of how a marginal gain analysis was performed is shown in Table 2.
We define access to trauma care as the ability to reach a trauma center within 30 minutes of driving time. A 30-minute drive time using existing road networks and rural drive time was used to assess access for three reasons.
First, the initial metric of the one-hour timeframe was not based on empirics, but rather an urban-biased goal to provide access to trauma care in the state of Maryland.(10–12) Second, a 30-minute drive time fits within the dogmatic application of the golden hour when considering the response time of EMS out to a call,(1,13) time the EMT uses to assess the emergency situation, and then travel time back to the trauma center. Third, the geographic context of Minnesota includes many rural areas, constrained rural road networks, and ecological features that require the use of road network data and taking into account factors that may affect response time in the west north-central region of the United States, such as weather, truck traffic, and wildlife.(14,15)
Therefore, using a 30-minute rural drive time and road networks captures contextual features while accounting for the time it takes to respond, assess, and return an emergency call while still fitting within the “golden hour” metric used to measure accessibility to trauma centers, taking into account the time it requires for EMS response, assessment, and transport.(5)
Coverage zones of 30 minutes driving time to each hospital were created using the ArcGIS Community Analyst tool. Community Analyst can create coverage zones based on mileage or driving time based on existing road networks. We used the “Rural Drive Time” option to create the zones because of the nature of the hospital locations outside of major metropolitan areas. Rural Drive Time captures the movement of automobiles, optimizing driving times, obeying all traffic rules. It does not discourage travel on unpaved or unimproved roads.(16,17)
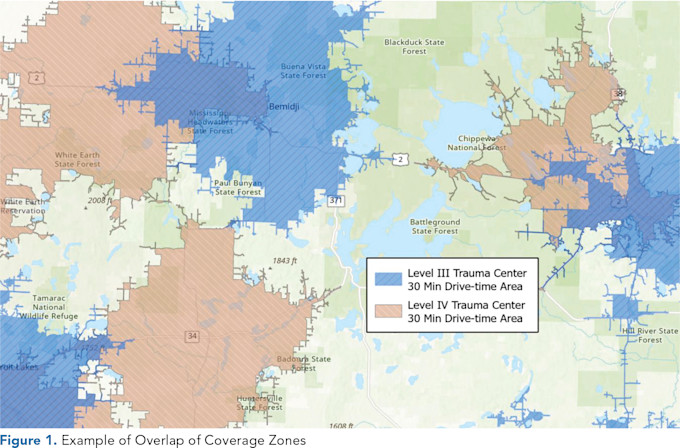
Once each area was defined for all five trauma levels, areas of overlap were removed. We examined the marginal gains that appeared along a gradient from highest to lowest trauma level designation. A marginal gain for this research is defined as the geographic territory that is covered by only one class of facility (ex: Level I, II, III, etc.) with no overlapping coverage by another class. For example, in Figure 1, Levels III and IV show a large amount of overlap covering the same area.
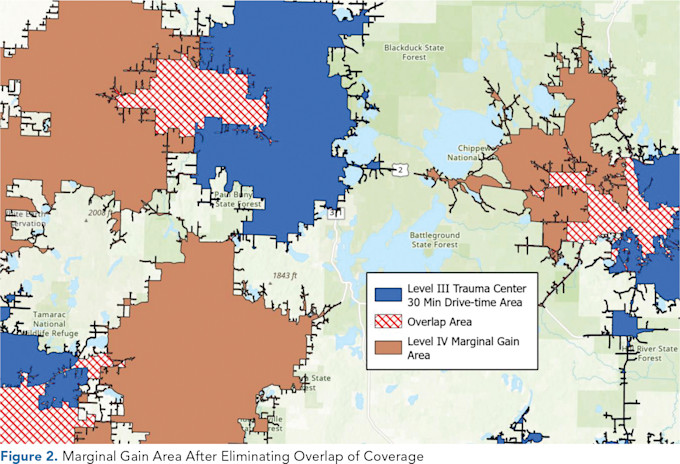
For each coverage zone, we used the Community Analyst tool to examine population attributes that are related to trauma. For further analysis, we also looked at data combining the Level I and II marginal gain zones and treated them as one contiguous area to examine the distinctness of rural/urban disparities in trauma coverage. Figure 2 shows the area of overlap that is eventually removed from the analysis, leaving the area of marginal gain that is distinct from the overlap of the higher level.
Our marginal gain analysis is advantageous for several reasons. First, our marginal gain analysis serves as a form of needs assessment to understand which populations and social groups have access to trauma care and levels of care and, reflected by public data on various social determinants of health, what those populations may need.
Second, our marginal gain analysis identifies spatial gaps in trauma care while incorporating the social landscape within the “golden hour” of care response by considering a 30-minute rural drive time using road networks to aggregate populations for analysis.
Third, our approach can inform the development of additional trauma centers and the potential locations where elevating the level of trauma care would improve access to trauma care. Furthermore, our method provides an analytical approach to predict and plan for future needs based on demographic changes. Our method is accessible to planners and healthcare administrators utilizing GIS tools to inform healthcare infrastructure development and policies.
RESULTS
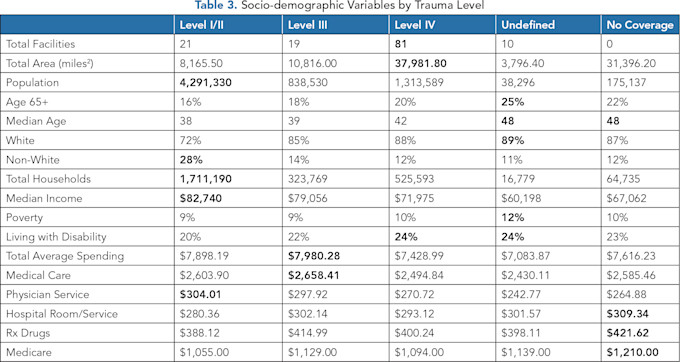
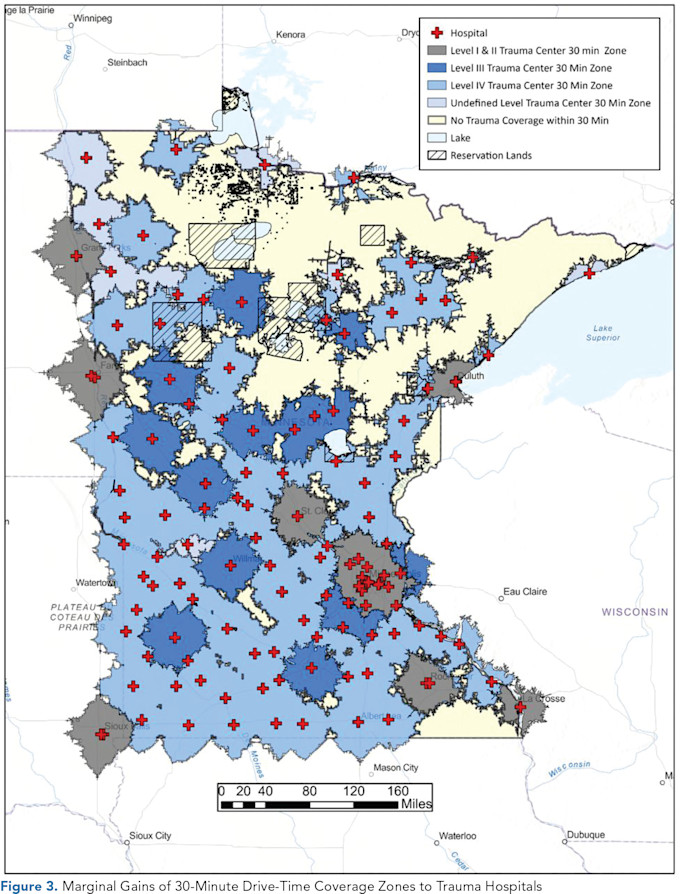
Table 3 shows a breakdown of the number of trauma hospitals by designation, areas covered, and the various demographic and socio-demographic characteristics. Figure 3 shows the areas of marginal gain after removing the overlaps from all the trauma coverage drive-time zones. Given the nature of driving times, cross-border adjacent-state populations are counted in this analysis. The state of Minnesota Department of Health includes trauma hospitals in adjacent states in its listing of trauma hospitals because of their accessibility and geographic location in border areas.
Socio-demographics
Most of the study area (64.5%) is served by Level I and II trauma centers, followed by Level IV (19.7%), and Level III (12.6%). Level IV trauma centers are prevalent across Minnesota, with 81 facilities covering about 41% of the state while providing access to trauma care for more than 1 million adults. Roughly 38,296 Minnesotans (~1%) live within access to one undefined trauma center, and just more than 175,000 Minnesotans live where there is no trauma care access within 30 minutes.
The population without adequate access to trauma care tends to be, on average, older, with higher proportions of people aged 65 and older. The undefined and areas of no coverage have higher median ages than populations within access to other trauma level centers.
There are more nuanced trends, such as the characteristics of the populations served by different levels of trauma care. Populations with access to varying levels of trauma care differed in median incomes, where income was associated with higher quality care. Level I and II populations had the highest median incomes ($82,740), lowest level of poverty, highest percentage of non-white population (27.8%), and lowest levels of people living with a disability (19.9%).
There is a drop in the percentage of non-whites and number of households with accessible care comparing the Level I and II facilities to the Level III facilities, with similar poverty rates, disability rates, and education. Households with access to Level IV trauma care have the highest percentage of people living with a disability, with median incomes about $10,000 less than populations with accessible Levels I and II care. These populations also have the highest percentage of those living with disabilities. The 16,779 households with access to the undefined trauma centers had the lowest percentage of non-whites, lowest median income, and highest poverty rates.
One advantage of this approach to analysis is that it provides a method to add spatial context specific to trauma center locations, allowing for more detailed information about populations that are most-likely to access those centers for care while accounting for the spatial overlap of these access zones.
This reveals unique local demographic trends that can get lost with aggregated or urban-centric data, including the disparities in trauma care access that reveal higher median incomes and lower poverty around the urban Level I and II trauma centers; Level III and IV centers are associated with higher disability rates and lower income levels. This information is helpful for planners and managers to anticipate future needs while identifying and addressing existing disparities related to trauma care access.
Cost of Care
Levels I and II have the highest physician costs, yet Level I and II have the lowest hospital room and service charges, cheapest prescription drugs, and lowest Medicare costs. Level III trauma centers have the highest average spending and highest costs for medical care, along with the second highest costs for physician services, prescription drugs, and hospital rooms and services. The costs for prescription drugs for Level IV are cheaper than for Level III, yet more expensive than Level I and II. Level IV also has the second-lowest costs for hospital rooms and services.
Those with access to undefined trauma centers, on average, pay the least for their care, have the lowest cost for physician service, and lower prescription drug costs than Levels III and IV. These people, however, also encounter the highest charges to Medicare.
On the other hand, populations with no access to trauma care have the second-highest average spending and the highest costs for prescription drugs, Medicare costs, and hospital rooms and services. Therefore, populations may be spending higher amounts on care and disease management if they do not live near accessible trauma care centers.
Another notable relationship is that much of the American Indian Reservation areas have no access to trauma care or have access to lower-level trauma centers around the boundaries of their lands. While other Indian Health Service organizations may serve indigenous populations in Minnesota that are not identifiable with this approach, our analysis still suggests that trauma care is less accessible for indigenous communities in the northern half of Minnesota.
Geographic Takeaways
Figure 3 also reveals significant access issues for the northern half of the state left uncovered by any trauma care system. Much of this area of the state is considered frontier based on population density and distance to urban centers, highlighting the spectrum of rurality that needs to be considered when assessing healthcare access in geographic contexts.(18) Level III trauma centers tend to be located around small micropolitan towns, and much of the coverage of Level IV centers covers designated frontier areas. In terms of cost, Level III trauma centers stand out. They have the highest average spending, highest cost of medical care, and come second in cost for a range of other medical expenses (physician service, hospital room and service, prescription drugs, Medicare).
Populations with access to undefined trauma centers and those with no coverage highlight potentially increasing needs. These areas had the highest rates of poverty and highest percentage of people aged 65 and older, and the relationships between age, poverty, increasing comorbidities, and increasing rates of neurodegenerative diseases indicates there could be a sharp demand in many health-related services, including trauma care.
CONCLUSION
This study describes our marginal gains analysis applied to the geographic locations of trauma care centers. The results are informative for healthcare infrastructure development and local healthcare policy. This method reveals several challenges for access to trauma care and helps identify who benefits and who remains underserved, considering race, income, and access.
While our findings suggest that people outside an accessible range of a trauma center (beyond the 30-minute rural drive time) pay more for medications and hospital stays and incur higher costs for Medicare, those with access to undefined trauma centers pay less. The higher costs could reflect differences in the cost of living between micropolitan areas and rural communities.
Although many American Indian reservations do not have easy access to trauma care, this study does not include Indian Health Services that may serve these populations in similar ways to other trauma centers in rural areas.
Furthermore, this article does not analyze air transport, which could improve access to trauma care and services, particularly for remote rural counties which may have agreements with trauma centers and air transportation systems. Findings from marginal gains analyses may identify locations that would benefit from air transportation arrangements to respond to trauma care.
The unique aspects of Level IV trauma centers emerge as a crucial component for rural healthcare delivery beyond trauma care. They have the largest geographic reach, covering just more than 41% of the area of the state of Minnesota and serve about 20% of the state’s population.
Level IV trauma centers serve a slightly higher percentage of adults with disabilities (24%) and may be critical transportation links between populations that are uncovered by trauma care or near trauma centers with no designation. Populations that have access to Level IV trauma centers, however, make less money than those near Levels I and II, and the cost of care is lower than in Levels I, II, and III, highlighting a consistent socio-economic disparity between those with access to Levels I and II and those without.
Interestingly, Level IV has the lowest rate for hospital and room services, lower prescription drug prices, and lower costs for Medicare, while Level III has the highest spending and cost for care. It could be that Level III is absorbing more care from people coming from areas accessible to lower levels of trauma care. It could also mean that rural residents must pay for these services along with the services they need to be transferred after a shorter stay at a lower-level trauma center.
The costs associated with higher level trauma centers are significant. One study of trauma centers in Georgia revealed readiness costs for a Level I trauma center more than double the costs of a Level II trauma center, and note large geographic gaps in trauma access for more rural and western states.(8)
While the patient benefits of readiness for higher level trauma seem obvious, the societal benefits would be at best complex to consider. Challenging the return on investment would be the reliance on billable encounters of trauma, which in rural areas may be, per patient, just as compelling and severe, yet infrequent or rare.
The cost disparities across trauma centers underscore the financial implications of rural trauma care in Minnesota. Research demonstrates that the socioeconomic context and rurality are linked in ways that contribute to increased barriers to accessible care where even those in rural communities who are economically well off are still unable to access the care they need.
Using a marginal gains analysis, policy planners and healthcare administrators can leverage publicly accessible data to get a more concise picture of who has access to which forms of care. The use of GIS can help identify the spatial gaps in care while simultaneously serving as a rubric to identify rural health interventions based on the social landscape around our healthcare infrastructure. Implementing social science and GIS techniques provides a new tool to tackle social and spatial inequities associated with healthcare access and serves as a blueprint to address rural social determinants of health.
References
Hsia RY, Shen YC. Changes in Geographical Access to Trauma Centers for Vulnerable Populations in the United States. Health Aff (Millwood). 2011;30(10):1912–1920. https://doi.org/10.1377/hlthaff.2011.0510
Branas CC, MacKenzie EJ, Williams JC, et al. Access to Trauma Centers in the United States. JAMA. 2005;293(21):2626–2633. https://doi.org/10.1001/jama.293.21.2626
Vernon TM, Cook AD, Horst MA, et al. A Preliminary Analysis of Level IV Trauma Centers Within an Organized Trauma System. J Trauma Acute Care Surg. 2019;87(3):666. https://doi.org/10.1097/TA.0000000000002383
Carr BG, Bowman AJ, Wolff CS, et al. Disparities in Access to Trauma Care in the United States: A Population-Based Analysis. Injury. 2017;48(2):332–338. https://doi.org/10.1016/j.injury.2017.01.008
Ferre AC, Curtis J, Flippin JA, et al. Do New Trauma Centers Provide Needed or Redundant Access? A Nationwide Analysis. J Trauma Acute Care Surg. 2022;93(3):347. https://doi.org/10.1097/TA.0000000000003652
Jarman MP, Castillo RC, Carlini AR, Kodadek LM, Haider AH. Rural Risk: Geographic Disparities in Trauma Mortality. Surgery. 2016;160(6):1551–1559. https://doi.org/10.1016/j.surg.2016.06.020
Brown JB, Rosengart MR, Billiar TR, Peitzman AB, Sperry JL. Distance Matters: Effect of Geographic Trauma System Resource Organization on Fatal Motor Vehicle Collisions. J Trauma Acute Care Surg. 2017;83(1):111. https://doi.org/10.1097/TA.0000000000001508
Medrano NW, Villarreal CL, Price MA, et al. Access to Trauma Center Care: A Statewide System-Based Approach. J Trauma Acute Care Surg. 2023;95(2):242. https://doi.org/10.1097/TA.0000000000004002
Minnesota Department of Health. Minnesota Statewide Trauma System. Minnesota Statewide Trauma System. Accessed October 22, 2024. https://www.health.state.mn.us/facilities/traumasystem/index.html .
Newgard CD, Schmicker RH, Hedges JR, et al. Emergency Medical Services Intervals and Survival in Trauma: Assessment of the “Golden Hour” in a North American Prospective Cohort. Ann Emerg Med. 2010;55(3):235–246.e4. https://doi.org/10.1016/j.annemergmed.2009.07.024
Lerner EB, Moscati RM. The Golden Hour: Scientific Fact or Medical “Urban Legend”? Acad Emerg Me. 2001;8(7):758–760. https://doi.org/10.1111/j.1553-2712.2001.tb00201.x
Fleet R, Poitras J. Have We Killed the Golden Hour of Trauma? Ann Emerg Med. 2011;57(1):73–74; author reply 74–75. https://doi.org/10.1016/j.annemergmed.2010.08.003
Rogers FB, Rittenhouse KJ, Gross BW. The Golden Hour in Trauma: Dogma or Medical Folklore? Injury. 2015;46(4):525–527. https://doi.org/10.1016/j.injury.2014.08.043
Boscoe FP, Henry KA, Zdeb MS. A Nationwide Comparison of Driving Distance Versus Straight-Line Distance to Hospitals. The Professional Geographer. 2012;64(2):188–196. https://doi.org/10.1080/00330124.2011.583586
Lam O, Broderick B, Toor S. How Far Americans Live from the Closest Hospital Differs by Community Type. Pew Research Center. Accessed February 21, 2023. https://www.pewresearch.org/fact-tank/2018/12/12/how-far-americans-live-from-the-closest-hospital-differs-by-community-type/ .
Nalin P, Bright P. Using Internet Databases to Advance Health Equity, Population Health, and Workforce Planning. Physician Leadership Journal. 2024;11(3):4–9. https://doi.org/10.55834/plj.2443875835
ArcGIS Community Analyst | Demographic Data & Planning Mapping Software. Accessed November 20, 2023. https://www.esri.com/en-us/arcgis/products/arcgis-community-analyst/overview .
USDA ERS – Rural Classifications. Accessed October 10, 2024. https://www.ers.usda.gov/topics/rural-economy-population/rural-classifications/ .