
Hospital consolidation is on the rise. Annual hospital and health system merger and acquisition activity increased from 38 deals in 2003 to 115 in 2017.(1) In fact, by 2017 “more than 27% of the 4,600 acute care hospitals tracked by Medicare were owned by 20 hospital companies.”(2) The latest wave of “merger mania” in healthcare appears to be driven by various government provisions that aim to move the system from volume to value, including alternative payment models as conceptualized in the Affordable Care Act and the Medicare Access and CHIP Re-Authorization Act (MACRA).(3) The consolidation trend is likely to continue, fueled further by the financial impacts of the pandemic.(4)
Much has been written about the increase in hospital consolidation in the United States and its impact on hospital prices and total healthcare costs. Several studies have shown that increased consolidation leads to higher hospital prices and overall healthcare costs, although a study recently commissioned by the American Hospital Association actually makes the case that merger and acquisitions activity reduced healthcare costs.(5-7) We believe, however, that the more important question is whether such consolidation actually leads to higher value (i.e., better quality at lower costs) for patients. A recent Modern Healthcare cover story, “The Pursuit of Systemness,” states that: “The industry rationale for this consolidation strategy is that larger entities have greater ability to reduce costs through bargaining clout and economies of scale, and that they are better able to invest in increasing quality of care and patient experience.”(2) Thus, the argument is that consolidation can increase healthcare value (i.e., the combined interaction of better patient outcomes, safety, service, and cost per patient).
How do these big consolidated systems fare in their ability to spread best practices, in both quality and cost, across their entire hospital network? Do they exhibit consistently high levels of value? Looking at quality alone, a major recent study by JAMA on cancer patient outcomes in 49 hospital systems around the United States concluded that, “The likelihood of surviving complex cancer surgery appears to be greater at the top-ranked cancer hospitals compared with the affiliated hospitals that share their brand.”(8) In nine of the examined systems, the flagship hospital exhibited a standardized mortality ratio of 0.5 or lower (i.e., better than the national average to excellent patient outcomes). However, only two of the nine systems had affiliated hospitals that showed a standardized mortality ratio of 0.75 of the national average or lower (i.e., better). This suggests that although some of the systems appear to share best practices and learn from each other, the majority do not. In fact, standardized mortality at one system’s flagship hospital was about 40% below (i.e., better) the national average, but its affiliates were more than twice as high (worse) as the national average. So healthcare quality appears to vary both across and within systems, suggesting that healthcare consolidation does not automatically translate into higher-quality care, a conclusion reached by previous studies.(9,10) This observation also is supported by a recent study analyzing the relationship between hospital mergers and quality of care in the Netherlands.(11) Using a mixed-methods approach the authors show that despite positive hospital staff perception, hospital consolidation does not lead to measurable improvements in quality of care and may, in fact, have negative impacts on patient care.
If our overarching goal is high value (not just high quality), we should also examine the other components of the value equation. Each of the value components (i.e., patient outcomes, safety, service, cost per patient) can be measured on a risk-adjusted basis. In fact, CMS provides a value index (total performance score [TPS]) consisting of those four key components for each hospital participating in the value-based purchasing (VBP) program.(12) To learn how the consolidated systems are performing on value, we began by analyzing the CMS VBP index for nine hospital systems, focusing on their facilities within a single state, California. We focused on a single state as a starting point of our analysis to avoid potential confounder variables associated with differential provider practice regulations that exist across the United States. Moreover, given the size and diversity of California’s population, we felt that it was a reasonable representation of what may be happening with hospital systems nationwide. To further strengthen the breadth and applicability of our findings, we used the same measure to analyze the performance of hospital systems whose facilities are highly ranked by U.S. News & World Report.
Study Data and Methods
State of California
Data on the CMS Value-Based Purchasing Total Performance Score was extracted from the Hospital Compare database (release date November 9, 2018),(13) and the American Hospital Directory(14) database was used to determine system affiliation and hospital characteristics. All of the hospitals across the nine analyzed systems had 100 or more beds, and all but one facility were classified as “teaching” by the Accreditation Council for Graduate Medical Education per American Hospital Directory database. We chose to focus on facilities with 100 or more beds to reduce data confounders associated with VBP reporting for smaller or specialty hospitals. We observed no correlation between hospital bed size and TPS within the cohort, nor was there a significant correlation between hospital type—urban versus rural—and TPS (data not shown). To provide additional context for the performance of consolidated health systems, we also obtained VBP scores for all VBP participating California hospitals with 100 or more beds to generate a statewide perspective of hospital performance on value. VBP scores for 195 California facilities were used to calculate the statewide VBP scores at the 25th, 50th, 75th, and 90th percentiles.
U.S. News & World Report Top 20
The list of the top 20 hospitals in the country was obtained from the U.S. News & World Report website in June 2021. The American Hospital Directory was then used to: 1) determine whether a given top-20 hospital was part of a larger health system; and 2) identify the other hospitals that belong to the same system. Individual hospitals and systems that had fewer than three facilities were eliminated from further analysis (total eliminated = 9). VBP scores for the 11 remaining hospital systems were extracted from the Hospital Compare database (release date December 16, 2020).13 We also generated a nationwide hospital performance perspective on value by starting with the list of all hospitals that participate in the CMS VBP program (over 3000 facilities nationwide) and filtering for: 1) hospitals that had complete data for each of the measures; and 2) hospitals that had more than 100 beds (as confirmed by American Hospital Directory). The resulting group of 1868 facilities was used to calculate the national VBP scores at the 25th, 50th, 75th, and 90th percentiles.
Key Drivers of Within-System Variability
The VBP total performance score is a composite score generated by the addition of equally weighted subcomponent scores across the following domains: clinical outcomes (25%); person and community engagement (25%); safety (25%); and efficiency and cost reduction (25%). Thus, as a first step toward understanding the drivers of the observed within-system variation in VBP TPS, we also examined the variation in each of the subcomponent scores. The subcomponent scores for each top-ranked health system and its network of facilities were extracted from the Hospital Compare Database (release date December 16, 2020). For each top-ranked health system, we calculated the mean, standard deviation, and relative standard deviation in each of the four score subcategories to find which were the most variable versus most consistent for each system.
Study Results
State of California
Table 1 shows the factor differences between each system’s highest-value hospital and its lowest-value hospital. The factor difference for each system ranged from 1.4 (or 40% difference in value score of the best hospital in the system versus the worst hospital in the system) to 2.7. Thus, to date, these hospital systems have not been able to generate consistent value across their networks. Table 1 also shows the percentage of each system’s hospitals that are worse than the overall 50th percentile value score for hospitals in California with 100 or more beds. Again, we find a lot of variability, with all of the hospitals in one system having value scores below the average for the state.
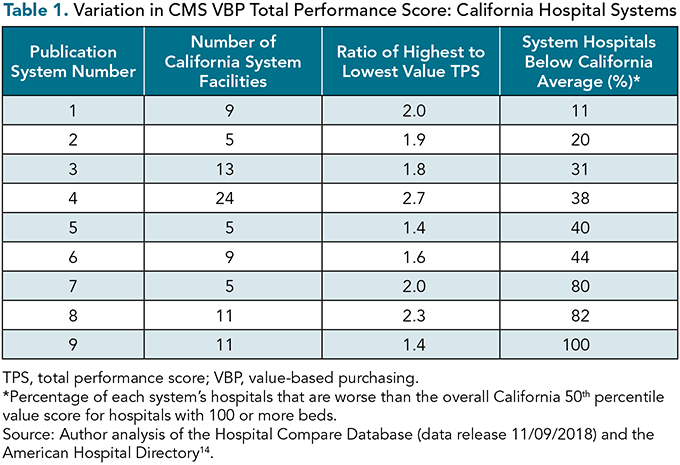
The data presented in Table 1 and Figure 1 point out the necessity of examining both the degree of consistency within a system and the overall value performance of the system. For example, System 1 is the best-performing system in the California cohort, with eight of its nine hospitals having TPSs above the California average. Moreover, its best-performing hospital also has the highest value score statewide. However, the factor difference between that top hospital and the worst-value hospital within the same system is 2.0. Thus the system has significant room for improvement and should be learning from its top hospital and then determining how to disseminate its best practices across the entire network. On the other hand, System 9 is tied for most consistent TPS, but none of its hospitals perform better than the state average. So, even though it has a tight range of TPS values across the network, it could still be argued that it is the worst-performing system in California.
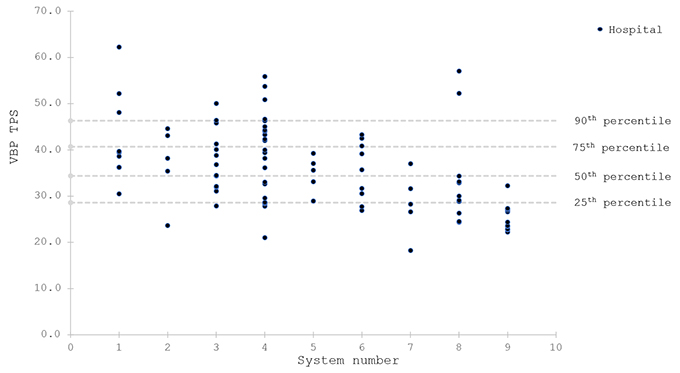
Figure 1. CMS VBP total performance score for the California hospital systems included in the study. Source/Notes: Author analysis of the Hospital Compare Database (data release November 9, 2018) and the American Hospital Directory.(14) TPS, total performance score; VBP, value-based purchasing.
U.S News & World Report Top 20
Table 2 shows the factor differences between each top-ranked system's highest- and lowest-value hospitals. The factor difference for each system ranged from 1.4 (or 40% difference in value score of the best hospital in the system vs. the worst hospital in the system) to 2.8. Thus to date, even these highly ranked hospital systems have not been able to generate consistent value across their networks. Figure 2 shows the variability in the value score within each of the highly ranked systems and compares that with the VBP performance of hospitals nationwide. Given that these systems represent the best that the United States has to offer, instead of focusing on their performance versus just the national average, we examined the number of top-system hospitals with value scores above the 75th percentile. Although in three systems all of the facilities scored above the 50th percentile, only one system’s facilities remained above the 75th percentile nationwide.

Here, again, the data presented in Table 2 and Figure 2 point to the need to examine both the degree of variation and the overall performance of a given system. For example, System 1 is best-performing, with all of its facilities scoring above the national 75th percentile TPS. However, there is a 0.6 (or 60%) difference in TPS between its highest- and lowest-ranked hospitals, suggesting that opportunities for improvement exist even among the best of the best. In contrast, Systems 10 and 11 are tied for the lowest within-system variability, but also are the worst performing overall, with all the facilities within each network scoring below the national 75th percentile TPS.

Figure 2. CMS VBP total performance score for the top hospital systems nationwide included in the study. Source/Notes: Author analysis of the Hospital Compare Database (data release 12/16/2020) and the American Hospital Directory.(14) TPS, total performance score; VBP, value-based purchasing.
Key Drivers of Within-System Variability
We observed within-system performance variability across all subcomponent dimensions of the TPS of top-ranked systems, but the “efficiency and cost reduction” domain consistently showed the highest spread as measured by relative standard deviation. Moreover, in one system, all facilities received a zero score (i.e., no improvement) in the “efficiency and cost reduction” domain. In contrast, the “clinical outcomes” domain showed the most consistency (6 out of 11 systems), followed by the “patient and community engagement” domain (4 out of 11 systems).
Discussion
Proponents of healthcare consolidation argue that larger systems are better positioned to deliver consistently high-value care due to economies of scale and dissemination of best practices. The degree of within-system variation, as well as the overall TPS values observed in our study, suggest that this pursuit of “systemness” is still in its early stages, because even the top-ranked health systems show significant opportunities for improvement across their hospital networks. We were particularly surprised by the observation that the extent of within-system variation was similar among California-based organizations and that observed for the U.S. News & World Report top-ranked systems.
Moreover, the observation that the “efficiency and cost reduction” component of the TPS shows the highest degree of variation makes a strong case against one of the key arguments in favor of health system consolidation—namely, the “greater ability to reduce costs”—and lends additional support to prior observations that hospital consolidation does not necessarily translate into reduced healthcare costs. It was encouraging to see that the “clinical outcomes” domain showed the least amount of variation. As discussed previously, however, we should be striving not only for the least within-system variation but also for the highest value.
Reducing within-system variability is critical, because patients assume, when making treatment decisions, that the care provided across a given network of facilities is equivalent.
Although the current study was not designed to decipher all the underlying drivers of system and individual hospital performance, the degree of variation observed in this study suggests that additional exploration of the factors that drive the variability within and across hospital systems is warranted. Such factors may include organizational structure, culture, leadership, shared administrative services, IT infrastructure, and payment models. We believe that it is particularly important to profile systems that consistently demonstrate high value, because the insights and best practices from these organizations could enhance the value of care provided by a given system as a whole.
As pointed out by the JAMA cancer study, reducing within-system variability is critical, because patients assume, when making treatment decisions, that the care provided across a given network of facilities is equivalent. We believe, therefore, that hospital systems must assume responsibility for delivering truly consistent and high-value healthcare across their entire networks.
Limitations
Our observations on the ability of hospital systems to deliver consistent and high-value care are drawn primarily from a single value metric—the CMS VBP Total Performance Score—which has been previously critiqued for levying disproportionate penalties on hospitals that serve higher-acuity patients.(15) Variations in CMS VBP scores also have been shown to be associated with hospital profit status, geographic location, and the types and number of measures reported to CMS.(16) We believe that by examining within-system, rather than across-system, variation in value scores; doing so within a single state, as well as in the national context; and focusing on hospitals with 100 or more beds, our analysis removes at least some of these potential confounders. The reliance on CMS measures also limits our analysis to the value of care provided to Medicare beneficiaries. It is possible that the value of care provided to commercially insured or younger populations may be different.
Conclusion
Consolidation of hospitals is happening throughout the United States. Are these bigger systems bringing consistently high value? Our answer is: no—at least not yet. Given that individual patients often rely on “brand” and assume brand-equivalence when it comes to healthcare value, the degree of within-system variation described in this article is cause for concern. Hospital systems must assume responsibility for delivering truly consistent and high-value healthcare across their entire networks. One way to do that would be to identify the best-performing facilities within a given network and ensure the timely dissemination of learnings and best practices from that facility across the network.
References
2017 in Review: The Year M&A Shook the Healthcare Landscape. KaufmanHall. January 26, 2018. www.kaufmanhall.com/sites/default/files/legacy_files/kh_report-ma-year-in-review_d4-rebrand.pdf .
Meyer H, Kacik A. Health systems are working to live up to their name. Modern Healthcare. 2019. https://www.modernhealthcare.com/hospital-systems/health-systems-are-working-live-up-their-name .
Burns LR, Pauly MV. Transformation of the Health Care Industry: Curb Your Enthusiasm? Milbank Quarterly. 2018;96(1):57-109. https://doi.org/10.1111/1468-0009.12312
Gustafsson L, Blumenthal D. The pandemic will fuel consolidation in U.S. health care. Harvard Business Review. 2021. https://hbr.org/2021/03/the-pandemic-will-fuel-consolidation-in-u-s-health-care .
Scheffler RM, Arnold DR, Whaley CM. Consolidation trends in California’s health care system: impacts on ACA premiums and outpatient visit prices. Health Affairs. 2018;37:1409-1416. https://doi.org/10.1377/hlthaff.2018.0472
The impact of hospital consolidation on medical costs. NCCI Insights. 2018. https://www.ncci.com/Articles/Pages/II_Insights_QEB_Impact-of-Hospital-Consolidation-on-Medical-Costs.aspx
Noether M, May S, Stearns B. Views from hospital leaders and econometric analysis - an update. American Hospital Association. 2019. https://www.aha.org/system/files/media/file/2019/09/cra-report-merger-benefits-2019-f.pdf .
Hoag JR, Resio BJ, Monsalve AF, et al. Differential safety between top-ranked cancer hospitals and their affiliates for complex cancer surgery. JAMA Network Open. 2019;2(4):e191912. https://doi.org/10.1001/jamanetworkopen.2019.1912
Gaynor M. What to do about health-care markets? Policies to make health-care markets work. Brookings: The Hamilton Project. 2020. www.brookings.edu/research/what-to-do-about-health-care-markets-policies-to-make-health-care-markets-work/
Gaynor M, Ho K, Town R. The industrial organization of health care markets. National Bureau of Economic Research. January 16, 2014. https://doi.org/10.3386/w19800
Westra D, Angeli F, Kemp R, Batterink M, Reitsma J. If you say so: a mixed-method study of hospital mergers and quality of care. Health Care Management Review. 2022;47(1):37–48. https://doi.org/10.1097/HMR.0000000000000302
The Hospital Value-Based Purchasing (VBP) Program. CMS.gov. www.cms.gov/Medicare/Quality-Initiatives-Patient-Assessment-Instruments/Value-Based-Programs/HVBP/Hospital-Value-Based-Purchasing .
CMS. Provider Data Catalog. https://data.cms.gov/provider-data/dataset/ypbt-wvdk
American Hospital Directory—information about hospitals from public and private data sources including MedPAR, OPPS, hospital cost reports, and other CMS files. www.ahd.com/
Jha AK, Orav EJ, Zheng J, Epstein AM. The characteristics and performance of hospitals that care for elderly Hispanic Americans. Health Affairs. 2008;27(2):528-537. https://doi.org/10.1377/hlthaff.27.2.528
Borah BJ, Rock MG, Wood DL, Roellinger DL, Johnson MG, Naessens JM. Association between value-based purchasing score and hospital characteristics. BMC Health Services Research. 2012;12:464. https://doi.org/10.1186/1472-6963-12-464